No magic

In times of rain, fog and drizzles, I take the U-Bahn for commuting to and from work. I'm not as regular as your proverbial clockwork, but still punctual enough to see certain co-commuters on an almost daily basis. Some of them are individual enough to stick out of the crowd. Sir David, for example, a long thin figure with short grey hair and a short, accurately trimmed grey beard, invariably dressed in a checkered grey suit with a light grey shirt and a gunmetal grey tie, dark grey suede shoes and charcoal grey socks. Even his beyerdynamic headphones, which he's sure to wear, are grey, and while listening to Vivaldi, he's studying the daily Frankfurter Allgemeine with great interest and concentration.

Such intense is his concentration that he does not even notice Mike sitting next to him with a battered Nokia cell phone and talking very loudly, as every day, in an unidentifiable language with what I assume to be a subordinate of Mike. Mike is ebony black, 6'4'', 150+ kg, wears a gold Rolex and other golden accessories over a black Savile Row suit but still manages to look like a very serious and very worried business man. When U2 goes underground at Potsdamer Platz and his phone loses the connection (as every day), his worries grow troublesome for his health as accentuated by repeated violent bursts of shouting at his unfortunate subordinate who, luckily for him or her, can't hear the verbal assault because of the severed connection.

Despite this acoustic disturbance, Sir David remains concentrated on his newspaper and entirely misses Audrey stepping into the train. Audrey is a seriously cute American girl in her twenties with dazzling blue eyes and jet black hair she's wearing as an asymmetric bob. Unlike many Americans, she has a soft, melodious voice which is as pleasant to listen to as she's a pleasure to look at, despite her constant fumbling with a white Apple Watch. Today, however, she's discussing a technical subject with one of her colleagues from the advertising agency she's working for. The guy is the living prototype of a Berlin-Mitte hipster with the trade-mark combination of an undercut leaving a 2 cm ponytail stub at the back and a beard of Abrahamian dimensions in front, together with the indispensable oversized horn-rimmed black glasses fulfilling no medical function but representing a fashion statement.

He seems to believe, as many non-native speakers, that an excessive use of the F-word documents an intimate familiarity with both the American language and the American culture, and thus demonstrates that you are on the level. Know what I'm sayin'? Fuck, eh. Right now, he keeps whining, in a high wheezy voice not fitting the beard, that his brochure wasn't accepted because the fucking pdf was too fucking big, fuck eh. Know what I fucking mean, eh? Audrey knows, and contrary to what I would have expected, she's reacting in a totally enthusiastic way. Oh so true, she cheers, and adds immediately that she's recently found the solution for big pdfs that seem to be the major, if not the problem troubling her agency. A wonderful, an absolutely fabulous web service! Her original pdf of 500 MB reduced to 10 MB without any loss of quality! Pure magic! But ... who ... ?, her hipster colleague manages to ask, and she's shouting at him, full of delight: ILOVEPDF DOT COM!

Two days later one of my colleagues (with a PhD in physics) tells me that he used ilovepdf.com to compress the pdf of his recent publication, so that it's of a size suitable for uploading to arXiv. He shows me the result, and I'm impressed: there are no immediately obvious compression artifacts, although the file size has been reduced from more than eight to just one MB. Now I'm really getting curious. Is it possible that these ilovepdf guys are doing something ... clever? Perhaps they employ one of the new image formats, such as webp, bpg, or even flif? That would be most interesting, and I thus set out to get to the core of this business.

Several web services promise to compress images (or, more precisely, pixel graphics or, synonymously, raster image files, or short, bitmaps or pixmaps) of various formats or entire pdf documents (where the compression, of course, boils down to exactly the same: compressing the pixmaps embedded in the pdf container). All of them also promise to respect our privacy. For example, ilovepdf.com (and iloveimg.com) states:

Absolutely all uploaded files on ilovepdf.com are deleted from our servers one, two or twenty-four hours (depending on if a user is non registered, registered or premium) after been processed.

Hmmm. Why only the uploaded files? What about the compressed ones? I like the statement of smallpdf.com better:

Please note that uploaded and processed files are never stored longer than an hour on our servers and then are deleted permanently. During this hour your files are not accessed, copied, analyzed or anything else except we have the explicit permission of the user for example for a support case.

“Analyzed” is the key term here. Even if the uploaded and processed files are deleted, it takes only fractions of a second to extract the text of pdf documents, or the raw pixmaps embedded in them:

        less upload.pdf > text.txt
        mutool extraxt upload.pdf

On tinypng.com, we only read:

Submitted content will not be shared with third parties other than Voormedia’s service providers, unless required to comply with the law or requests of governmental entities. Voormedia uses service providers based in the USA.

For the present case of use (getting a file size acceptable for arXiv), all of that doesn't seem to matter. After all, our intention is to publish our content, not to keep it confidential. The same goes for Audrey and her agency. Still ... if you can do it yourself, why should you become dependent on others? And after you have made yourself depending on this service, what will you do when it really matters?

But can we do it ourselves? Are the results of these services within our reach, or are their makers truly magicians with capabilities beyond the John and Susan Does of the interwebs? To narrow it down to the point which matters most for me: can these services, given a file that I deem to be suitable for publication, significantly compress it further? After all, I know how to treat my images, don't I? Well, at least I believe I do.

I've made a comparison using several pdf documents (including the publication of my colleague above) as well with a few raster images. To my simultaneous relief and disappointment, the most frequent statement I got from the web services under consideration included:

We are sorry, your file is very well compressed and we can't compress it without quality loss.

Or, as honest as cute:

We compressed your file from 30.36 kB to 29.57 kB. That's not that much. Sorry.

No magic, no new formats. What a pity! At the same time, I was impressed by the technical quality of these services. All documents and images returned from them were an excellent compromise between image quality and size. Furthermore, I actually never managed to produce an image of equal quality but smaller file size. But I was always close with very little effort.

To give explicit examples: the publication of my colleague was 8.3 MB in size. The sole reason for the large size were a couple of images embedded as uncompressed tiff. I would normally compress these images prior to generating the pdf with pdfLaTeX, of course, but we can equally well compress them afterwards. Our two services return files of 0.95 (ilove) and 0.86 MB (small). I have to magnify them a five, even a tenfold to see the effects of compression. Yes, these services use lossy compression schemes, specifically jpeg, but they do that expertly.

What could John Doe do against specialized services jam-packed with expertise and knowledge on image compression? Well, I just tried to apply the little I know, like this (well-known) ghostscript one-liner:

            gs -sDEVICE=pdfwrite -dPDFSETTINGS=/default -dNOPAUSE -dQUIET 
            -dBATCH -sOutputFile=out.pdf in.pdf

resulting in

                gs (default):       1.41 MB     83% 
                gs (ebook)          1.05 MB     87%
                ilovepdf:           0.95 MB     89%         
                gs (screen)         0.94 MB     89%
                smallpdf            0.86 MB     90%

With the default setting, image quality is basically indistinguishable from the original and thus even better than the files produced by ilove and small. The higher compression stages of ghostscript with compression ratios rivaling those of ilove and small produce visual artifacts in this particular case, but are always worth a glance when trying to compress a pdf.

The conclusion of this exercise is obvious, I believe. Pixmaps for inclusion in documents should be compressed, most preferably losslessly. At the moment of writing, the most suitable format for images in my trade is png. These images can be compressed further (but lossily!) by reducing the range of colors (with pngquant, for example, or simply by converting them to greyscale). For photographs with soft contrasts and 16 M colors, jpeg remains the reigning format, but we have to be very careful not to reduce the image quality in an obvious way. And if you forgot all that and are facing a giant pdf that cannot be uploaded anywhere, use ghostscript.

That's it. That's all there is to know (at least concerning the current topic). I plan to look at new image formats, though, but those will be the subject of future posts. 😉
Display manager

To simplify my life, I'm continuously trying to standardize the software configuration of all physical and virtual Linux installations I'm administering. In terms of Linux distributions, I've already reduced the previous diversity to ArchLinux and Debian Sid/Testing. As window manager, I'm using either wmii or OpenBox. The former is started via startx and a corresponding entry in ~/.xinitrc, but what about the latter? Well, of course, I'm using a display manager to start it.

But which one? For some (probably historical) reason, I've set up my four systems with three different display managers: lxdm, lightdm, and slim, and of course I've no idea which system is actually employing which display manager. Surely, the Swiss knife of system information should know.

 ➜  ~ inxi -xx -S
System:    Host: deepgreen Kernel: 4.7.4-1-ARCH x86_64 (64 bit gcc: 6.2.1)
Desktop: Openbox 3.6.1 dm: N/A Distro: Arch Linux

Not necessarily, as you see.

Since I'm also using systemd, /etc/systemd/system/display-manager.service contains the required information. Debian-based systems offer in addition /etc/X11/default-display-manager. And for those not using systemd: you should know what you're doing anyway.

In the old days

Research places like the one I'm associated with are characterized by a constant turnover of personnel. Currently, our 20 senior scientists are supported by about 50 assistant and associate researchers on temporary positions. Our annual turnover rate is thus as high as 30 to 40%, meaning that I meet about 15 to 20 new people every year.

The level of understanding in physics and material science fluctuates, but does not seem to deteriorate over the years. That's the good news. What does decline significantly is the ability to read and write and to use a computer efficiently. At the same time, the fraction of people with an undue sense of entitlement is growing dramatically.

What do I call an “undue sense of entitlement”? Well, imagine. It's your first day at a new place where you hope to perform top-notch research yielding results important enough to publish them in prestigious journals. You are shown into your office, which you share with some more experienced colleagues, and on your desk sits a brand-new 24 inch Full-HD display connected to an equally brand-new desktop computer. And exactly that's the moment when you demand, loud and clear, two monitors. The bigger the better! And an hour later, you call our IT service to demand the real Office. And Photoshop! When the IT freaks ask for which purpose you need this software, you most strongly express your righteous indignation. First of all, that's none of his business, and second, that should be obvious! After all, you have letters to write. And later, there may be images whose contrast needs to be increased.

Now, that's exactly what you would do, right?

No, of course not. No halfway sensible person would behave in this way. Alas, every year we get more and more young people with this attitude. Experience tells us that the people demanding the most are the ones returning the least. They also tend to create constant trouble: they are more concerned with their own self-importance than with their research, and are generally ignorant, obnoxious, and unproductive.

I still vividly remember my own time as a PhD student at the MPI-FKF. I had previously written my diploma thesis on an HP Vectra, an IBM AT compatible, which I had to share with the six or seven members of our research group. At the weekends, I also had access to my own computer, an Schneider PC1512 that I primarily used for running Pascal programs. God, did it feel slow compared to the Vectra at work! At the MPI, however, computing was not yet “personal”. Instead, VT220 text terminals were offered for the interaction with the VAX station in the basement. I'd say we had perhaps 20 terminals for about 300 scientists.

Basically, these terminals were used for three essential tasks. First, one could receive and send e-mails using the 'mail' program. That was my first contact with the Internet and I found it exciting! Second, we wrote our manuscripts using EVE, the extensible versatile editor, compiled them with LaTeX, converted the resulting dvi file to postscript with dvips, and used lpr to send the postscript output to one of the three or four Hewlett-Packard LaserJets located at strategic locations (mine was close to the beer machine¹) in the institute. The VT220 could not display any graphics, so we had to print to see if our LaTeX code did what we wanted! Third, EVE was also used to write FORTRAN code, and there were always a number of computations running on our VAX. I do not remember which model we had, but a VAX 6360 from 1988 had six processors clocked at 16.7 MHz and an estimated performance of 22 MIPS, all for a meager $752K. A high-end smartphone is easily 1000 times as fast.

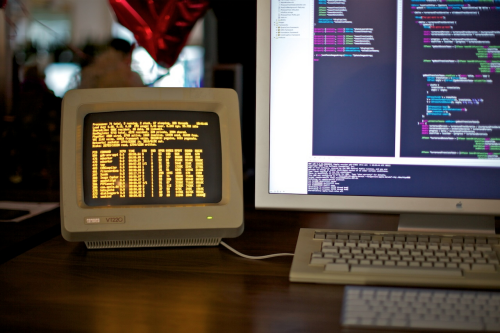
Just that you have an idea of how it feels to work on a VT220, here's an impression recorded by jstn. The little cube on the left is the VT220 displaying a terminal of the Mac Pro it is connected to.

Between January 1990 and September 1991, I wrote 10 manuscripts on this little cube as the first author (all of which got published) followed by my dissertation which I've submitted just before Christmas 91. How I did that? Instead of complaining, I typed.

¹ Yes, you heard right: we had a beer machine. All right, it was actually a standard soda machine, but it offered two kinds of beer in addition to Coke and Co.: Stuttgarter Hofbräu Pils and Export, if I remember correctly. The machine was heavily frequented and we had the most illuminating discussions in the park just outside the canteen, where the beer machine—and the printer—were located. Many great ideas originated from these discussions. Nowadays, where people wear a helmet when going to the loo, that's unimaginable.

Donkeyware

Our entire IT department is on vacation. All of them, the sysadmins, the netadmins, and the helpdeskers providing first level support. How on earth could we let that happen? Well, it's all just one guy. 😉

During any of his vacations, I am suddenly the most popular person in the institute. I'm happy to help where I can, and the most common “problem” are usually forgotten or mistyped passwords. This time, however, it turned out to be more interesting.

Actually, I was among the first users suffering from this year's problem. I have a virtual machine with a Windows 7 that was last updated in June. I've devoted only one core and 2 GB of RAM to this installation as it's only rarely used and not for much anyway. A few weeks ago, I've noticed that the system was entirely unresponsive, and found that 'svchost.exe' utilized 100% CPU. “Windows”, I thought, and closed the virtual machine.

Last week, several of our users suddenly complained that "their" Windows update doesn' t work any more. I've checked and found the same symptom of svchost running wild. The resource monitor showed that it is actually 'wuauserve.exe' (the Windows update service) consuming all CPU cycles.

It turned out that this problem exists since quite some time, and Microsoft has repeatedly tried to address it by providing new versions of the Windows update client. I was able to solve it in all cases by following the directions provided here. If you find this link helpful, ask yourself why you've spent money on a software produced by the greatest bunglers in this business.

This backup is futile

A couple of month ago, I noticed that I could not mount the filesystem created by attic, the program I was using to backup my data. A temporary inconvenience, I thought. Will certainly be fixed in a matter of days, I reasoned. But the situation was unchanged after two weeks, and to my great dismay, I found that I was also unable to extract single files from the backups. Attic was thus dutifully doing its hourly job, but I could have equally well directed all of them to /dev/null.

When searching for the issue, I discovered this thread. Attic was not yet completely broken at that time, but the stance of its developer is still remarkable:

Attic is my "feel good" pet project that I want to be able to code on whenever I happen to get some spare time. And when I have as little spare time as I currently have, I really do not want to spend it all on reviewing, merging, debugging and rewriting other peoples code.

Why on earth did he ever put his “pet project” on github then?

Since the community was interested, the project was forked. I switched to the fork and never looked back.

If you have an existing attic backup, all you have to do is to upgrade it by issuing

borg upgrade -v /path/to/repository

and to replace 'attic' by 'borg' in all backup scripts you may have. There is one major difference, though: if you want compression, you have to explicitly enable it, since borg allows you to chose the compression algorithm as well as the compression level.

As an example, here's the shell script I use to backup deepgreen (my Fujitsu Lifebook) to the big disk in my desktop (blackvelvet) via wifi:

#!/bin/bash
#<https://github.com/borgbackup/borg>
#<https://borgbackup.readthedocs.io/en/stable/index.html>
ionice -c3 -p$$
repository="cobra@blackvelvet:/bam/backup/attic/deepgreen" # directory backing up to
excludelist="/home/cobra/bin/exclude_from_attic.txt"
hostname=$(echo $HOSTNAME)
notify-send "Starting backup"
  borg create --info --stats --compression lz4              \
  $repository::$hostname-`date +%Y-%m-%d--%H:%M:%S`         \
  /home/cobra                                               \
  --exclude-from $excludelist                               \
  --exclude-caches
notify-send "Backup complete"
  borg prune --info $repository --keep-within=1d --keep-daily=7 --keep-weekly=4 --keep-monthly=6
  borg list $repository

Messlatte

The German term 'Messlatte' is usually used figuratively to label something which sets a standard, serves as a reference or constitutes a benchmark with which others of the same kind have to be compared to. The headline of c't 11/2016 reads 'Messlatte MacBook?', and the corresponding article has a remarkably surreal introduction:

Apples MacBooks haben sich in vielen Köpfen als die Referenz für Notebooks festgesetzt: teuer, aber schick und gut. Windows-Notebooks haben allerdings aufgeholt – und bieten in mancherlei Aspekt sogar mehr.

In my experience, nobody with an at least rudimentary ability of logical thinking would view MacBooks as 'reference' for notebooks. I'd suggest 'accessories' instead of 'notebooks', but let's see what the article says.

The c't found the MacBook 2016 to be the lightest and slimmest of all contenders. They also report that thanks to this absolutely fantastic and totally unbelievable slimness, there's only space for one port (USB-C), the keyboard has poor tactile feedback due to its insufficient stroke depth, and the CPU performance suffers from insufficient cooling.

How much does it suffer? The (fanless) MacBook 2016 has the same CPU as the (equally fanless) HP Elitebook G1, namely, a Core m5-6y54. In CinebenchR15 (Multi, 64 bit), the Elitebook scores 248 points and the MacBook 122.

One hundred and twenty two. You want to know how bad that is?

In a previous post, I've lamented on the fact that AMD's notebook top model A10-4600M launched in 2012 was not able to deliver a better performance than my low-level Pentium P6200 from 2010. Now, this A10-4600M has a CinebenchR15 (Multi, 64 bit) mark of 187 points, i.e., over 50% more than the current MacBook. Note that the P6200, which I estimate to deliver about 150 CinebenchR15 points, is in my case powering a Fujitsu Lifebook bought in 2011 for €299. Also note that Apple charges €1800 for the MacBook as tested by c't.

You get the same performance for a price tag of €300 in contemporary low-end notebooks powered by Baytrail Atoms, such as the Pentium N3540. Have a look here.

In the same volume, c't also tested two entry-level desktop processors, which are currently available for €60. The Pentium G4400 scores 140 points in CinebenchR15. Single thread. Both cores together achieve 269 points. The quad-core Athlon X4 845 gets 309 points. That's about the performance you get from the contenders of the MacBook equipped with a Skylake generation Core i7, such as the Dell Latitude E7270 (311 points).

Surprised? Always thought an i7 leaves everything else in the dust? Well, i7 is not i7. The performance of ultrabooks is limited by their design factor, and is currently not better than that of desktops available for a quarter of the price—or much worse, as in the case of the MacBook 2016. High-end desktops, by the way, deliver about 900 points and are thus about three times more performant. If you're interested in a comparison of the raw numbercrunching performance of desktop and notebook CPUs, look here.

Interestingly, c't employed an absolute scale and declared all notebooks with a price tag above the €1800 of the MacBook as expensive or very expensive. The Dell mentioned above, for example, was labeled as 'expensive' because of its price tag of €2000. The c't emphasized how much you get for that: namely, a business notebook with options for docking stations, plenty of ports, and three years on-site service, in contrast to the MacBook with none of that.

In my view, that's certainly all very nice to have, but what really counts is the 255% higher performance of the Dell compared to 'Messlatte'. A computer is a computer and should still be mostly defined by its ability to compute.

Indices

A ȷupyter notebook

Scientists move in mysterious ways, particularly when they try to measure their individual performance as a scientist. As I've explained in a previous post, the most popular and commonly accepted of these measures is the h index $\mathcal{H}$, which has been declared to be superfluous on both empirical and mathematical grounds. Either of these references relates $\mathcal{H}$ to the square root of the total number of citations $\mathcal{N}$, the first one approximately

$\mathcal{H} \approx 0.5 \sqrt{\mathcal{N}}$

and the second one exactly:

$\mathcal{H}=\sqrt{6}\log{2}\sqrt{\mathcal{N}}/\pi \approx 0.54 \sqrt{\mathcal{N}} $.

Since I anyway wanted to test pandas, seaborn and statsmodel, I gathered $\mathcal{H}$, $\mathcal{N}$, and the i10 index $\mathcal{I}$ from all my coauthors on Google Scholar. It turned out that not even a quarter of my coauthors have a Google Scholar account, but I figured that 71 data points would provide an acceptable statistics.

%matplotlib inline

import pandas as pd
import numpy as np
import matplotlib as mpl
import matplotlib.pyplot as plt
import statsmodels.formula.api as sm
import seaborn as sns
# read data into a Pandas DataFrame
data = pd.read_table("/home/cobra/ownCloud/MyStuff/projects/python/publishing/hindex.dat")
# check the data head
data.head()
Citations Hindex i10index
0 952 12 17
1 1913 20 35
2 5327 34 151
3 650 13 14
4 3855 25 68

Looks all right.

logdata = np.log10(data)

The correlation of the data is much more clear when displayed logarithmically:

vars = ["Citations", "Hindex", "i10index"]
sns.pairplot(logdata, vars=vars, size=3, kind="reg");

png

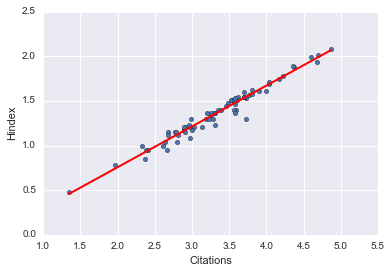
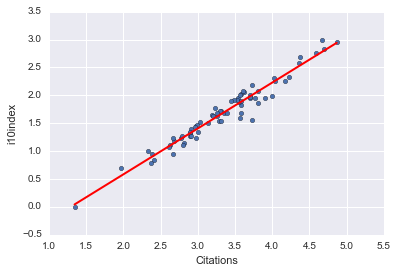
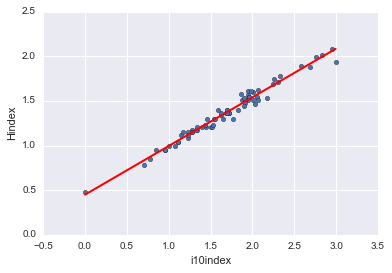
Now look at that! Two lines of code and seaborn visualizes all correlations in my data set. The diagonal elements of this 3x3 matrix plot show the distributions of $\mathcal{N}$, $\mathcal{H}$, and $\mathcal{I}$ (which seem to be close to normal distributions), and the off-diagonal elements visualize their correlations emphasized by a linear regression (kind="reg"). And how correlated they are! There's indeed no need for a definition of 'indices' if the number of citations is all what it boils down to.

Seaborn is great for visualization, as we have seen, but for quantitative statistical information, it's better to use statsmodel:

hc = sm.ols(formula='Hindex ~ Citations', data=logdata)
fithc = hc.fit()

ic = sm.ols(formula='i10index ~ Citations', data=logdata)
fitic = ic.fit()

hi = sm.ols(formula='Hindex ~ i10index', data=logdata)
fithi = hi.fit()

Let's compare the slope of our data with that predicted above:

fithc.params.Citations
0.45708354021378172
np.sqrt(6)*np.log(2)/np.pi
0.54044463946673071

Solid state phycisists have to work harder!

One can get also get more information, if desired:

fithi.summary()
OLS Regression Results
Dep. Variable: Hindex R-squared: 0.974
Model: OLS Adj. R-squared: 0.974
Method: Least Squares F-statistic: 2592.
Date: Mon, 16 May 2016 Prob (F-statistic): 1.84e-56
Time: 14:42:47 Log-Likelihood: 114.08
No. Observations: 71 AIC: -224.2
Df Residuals: 69 BIC: -219.6
Df Model: 1
Covariance Type: nonrobust
coef std err t P>|t| [95.0% Conf. Int.]
Intercept 0.4498 0.019 23.723 0.000 0.412 0.488
i10index 0.5454 0.011 50.910 0.000 0.524 0.567
Omnibus: 3.438 Durbin-Watson: 2.391
Prob(Omnibus): 0.179 Jarque-Bera (JB): 2.600
Skew: -0.408 Prob(JB): 0.273
Kurtosis: 3.462 Cond. No. 7.44

And of course, we can display these fits independent of seaborn:

xlist_cit = pd.DataFrame({'Citations': [logdata.Citations.min(), logdata.Citations.max()]})
xlist_i10 = pd.DataFrame({'i10index': [logdata.i10index.min(), logdata.i10index.max()]})
preds_hcit = fithc.predict(xlist_cit)
preds_hcit;

preds_i10cit = fitic.predict(xlist_cit)
preds_i10cit;

preds_hi10 = fithi.predict(xlist_i10)
preds_hi10;
logdata.plot(kind='scatter', x='Citations', y='Hindex')
plt.plot(xlist_cit, preds_hcit, c='red', linewidth=2);

logdata.plot(kind='scatter', x='Citations', y='i10index')
plt.plot(xlist_cit, preds_i10cit, c='red', linewidth=2);

logdata.plot(kind='scatter', x='i10index', y='Hindex')
plt.plot(xlist_i10, preds_hi10, c='red', linewidth=2);

png

png

png

Ubuntu VSTS

I've used Ubuntu from 2008 to 2012 on actual hardware. I stopped using it mainly because it degraded from a usable Linux distribution to a bugriddled bundle of outdated packages that evolved in the wrong direction. Still, I kept a minimal LTS server as virtual machine which I believed to be potentially helpful to diagnose issues we might have with our Ubuntu server installation at work.

LTS? Stands for "long term support", is released every two years, and is advertised as being supported for five years.

I have known this promise to be false since 2010, and this knowledge has accelerated my departure from Ubuntu. The German computer magazine Hail Ubuntu c't has recently published an online article on Canonical's deception, but they otherwise consequently ignore other Linux distributions and treat Ubuntu as being the most (only?) suitable distribution for newbies. As if newbies wouldn't need security support.

To check the support status of the current version, I've upgraded my existing 14.04 installation to 16.04, which was released just two weeks ago. Canonical does not encourage this update, but recommends to wait until the first point release (16.04.1). To still be able to upgrade, the 'do-release-upgrade' tool needs the command line parameter 'd', directing it to also consider development versions. That's very interesting: the 16.04 LTS release, which is by viewed by many as the prototype of stability and reliability, is officially considered to be a development release.

And to give credit where credit is due: Canonical is right. While the upgrade itself was fast (10 min) and free of errors, and 16.04 boots up to the login prompt faster than ever, the X server exits with a segmentation fault. Just like the old times, and so Ubuntuish!

Fortunately, I do not need an X server to run 'ubuntu-support-status':

Percentage      Time
4.3             3y
2.9             9m
6.4             unsupported

Almost 14% of all packages are not covered by the 5y support (and almost half of those are unsupported at the day of installation). Note that I'm talking about a server installation with a total size of 2 GB and not a single package from multiverse. I don't even want to imagine the situation with a full-blown desktop installation.

A hierarchical toolchain

I'm an experimental physicist by education. But since quite some time, I do not frequently perform experiments myself. Instead, I'm essentially acting as a consultant. I help to design experiments, to interpret and analyze them. And mostly, I advice my colleagues how to publish the data they got from their experiments or computations. Which often means that I have to analyze data, process images, create graphs, and write text myself, but always in close collaboration with others.

This interactive and iterative process takes time. Since my order book is already filled for the rest of this year, it is important for me to do that efficiently for being able to process each request within a reasonable time frame. In particular, I want to have the same workflow everywhere, whether I'm using the desktop at the office or at home or my netbook at a conference in Nice (basically ruling out all proprietary software).

The following list provides an overview of the applications I've chosen to use for these tasks in a loose hierarchical order (my second choice is given in parentheses). The one-liner below each entry briefly summarizes my personal reasons for the first choice. If I feel inclined to do so, I will elaborate on them in separate, subsequent posts.

Operating system: Archlinux (Debian Testing)
Transparent, simple, up to date. And tons of packages.

Shell: fish (bash, zsh)
Feature complete with minimal configuration.

Remote shell: mosh + tmux
An ssh replacement. Stays connected.

Shell extensions: virtualenv + virtualfish (virtualenvwrapper)
Easiest way to separate different python-based projects (like this blog).

CL Calculator: calc + units
Easiest way to calculate almost everything on the CL.

CL Editor: vim
Easiest way to edit almost everything on the CL.

CL File manager: autojump + ranger (mc)
Super-fast file system navigation and management.

Backup: attic (obnam)
Fast, scrictable, deduplicating.

Notes, Journal, Tasks: zim
My notes for my cloud.

Cloud storage: ownCloud
My cloud with all current projects.

Reference management: Mendeley (JabRef)
Full text search in all pdfs, bibTeX export.

Browser: Chromium (Firefox) in a sandbox
Fast, stable, consistent UI, all extensions I need.

Data analysis: ȷupyter with numpy, scipy, sympy (Mathematica)
Computing without licence hassles. Great UI with MathJax support.

Image processing: ImageJ, Gimp
All I will ever need and more.

Vector graphics: Inkscape
Standard compliant svg, eps and pdf ready for the web or publications.

Figure creation: ȷupyter with matplotlib
Publication quality figures with standard compliant svg, eps, and pdf export.

Typesetting: LaTeX w/ BibTeX
The de facto standard.

Editing: Several. Currently giviving atom a chance.
Syntax highlighting, command and citation completion, syncTeX support.

Version control: mercurial (git)
Keeps track of changes. No more 'manuscript_v17c_XY_NK_LM.tex'.

LaTeX diff generation: scm-latexdiff
Lights up the changes. Essential for not having to read the same stuff again.

Sharing the cache

I have two systems at home running Archlinux, and even with an almost identical configuration. Isn't it a waste to update these systems independently, and thus to download the same packages twice? But of course it is!

I've searched for 'local repositories', but did not find the possibilities discussed in the pacman wiki entirely convincing. Days later, I stumbled across a discussion on the archlinux forum on pacserve,, which proved to be exactly the solution I wanted. The speed of updates across the wifi is something I can't get enough of. 😉

Highly recommended!